Acquisition Quality Control
Borrowing from Project Management 101, every project, whether it will result in the delivery a product or a service, needs to be monitored and controlled to ensure that the outcome satisfies the requirements of the project. In this chapter we will look at how the receiver nodes are monitored for quality and operational effectiveness as part of the overall quality control of the project.
When looking at acquisition quality control, there are 4 major components to consider, 3 of which we will look at in this article.
1. Are the sources operating properly?
2. Are the receivers operating properly?
3. Is the data management/recording instrumentation system working properly?
4. Is the quality of the data sufficient to meet the client’s requirements?
It is important to realize that the equipment can be functioning perfectly, but the resultant recorded data may not satisfy the requirements of the project. Here we will look at how to determine if the nodes are working properly and if the overall acquisition program including the sources, geometry and recorded data are all satisfactory.
Let’s start by looking at Table 2 which compares the QC capabilities for cabled and autonomous nodal systems for each component.
|
Component |
Cabled Systems Capability |
STRYDE System Capability |
|
Source |
Depends on source type, but can include real-time positioning and source attribute QC |
Depends on source type but can include real-time positioning and source attribute QC. Additional QC of source performance using STRYDE software that is compatible with all common source controllers. |
|
Receivers |
Survey department QC pre and post-plot receiver station positions. Live QC of spread health from the recording truck to identify issues such as line breaks, battery failures and sensor disconnection. |
Automated QC of receiver station positioning quality during stakeless deployment. Walk the line QC of key node health parameters (battery, memory, GNSS and recording status). Sensor testing using a shaker-table when nodes are cycled for charging and harvesting. |
|
Recording System |
Real time visualization of trace data and system diagnostics in the recording truck as data is acquired. |
Data driven quality attributes computed as seismic data is harvested from nodes. |
|
Seismic Data |
Visual QC of the records as they are recorded looking at signal to noise ratio, and key events in the data. Some onsite processing of the daily records may be performed to generate field stacks. |
QC and processing of data onsite as nodes are rolled through the charging and harvesting unit. QC is performed using custom-built software designed specifically for efficient handling of huge nodal datasets |
Table 2: Cable vs Nodal System QC comparison
Figure 8 shows the major components of the nodal system and the paths of communication and Quality Control. One major QC step involves making sure that the nodes are placed in the correct position relative to the survey plan.
The pre-planned receiver positions are loaded into the survey planning software, where they are merged with the node acquisition settings to create a “deployment plan”. This plan is loaded to the handheld devices used by field crews so that crews can efficiently and accurately navigate to deployment locations and program the nodes with the desired acquisition settings.
The survey planning software also generates the relational information describing the shot and receiver locations, the timing of the sources, and which receivers are designated as being “live” for each shot.
This information is essential for constructing final seismic deliverables from the individual continuous records recorded by the nodes
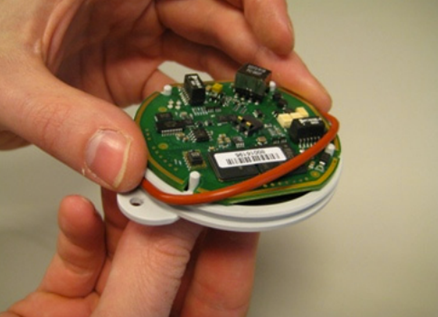
Figure 8 – System Topology
The Navigator app, shown in Figure 9, helps to make sure that the nodes are located according to the specified pre-plan coordinates. This app runs on a ruggedized Android device and is used alongside the “Initialisation Device™” to communicate with nodes. The Initialisation Device™ talks to the Navigator app over Bluetooth. When a node is docked in the Initialisation Device™, it communicates with the node using an optical link, and can perform tasks such as node deployment, retrieval, and in-field verification of node status. GNSS positioning quality QC limits can be programmed into the deployment plan loaded into the app to ensure consistent positioning quality across the survey.
Some projects require continuous seismic data recording over the entire duration of node deployment, whereas other surveys may have time constraints on when the nodes should start and stop recording each day. Recording parameters are set up once in the STRYDE system, and then automatically programmed into the node at deployment time, ensuring efficient and error-free deployment operations.
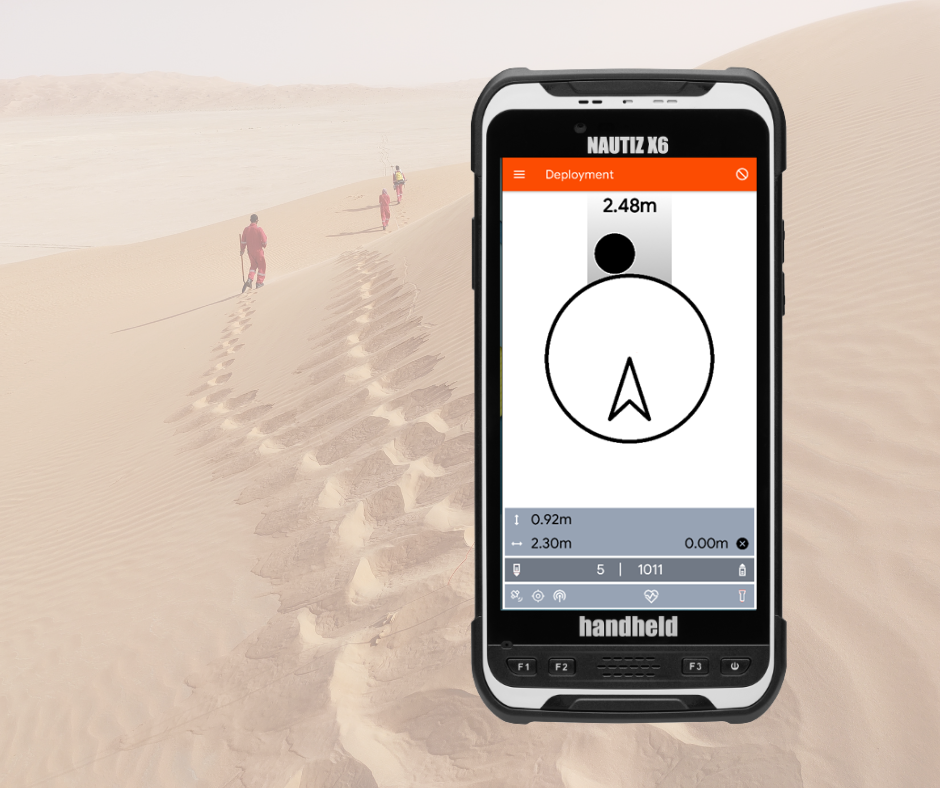
Figure 9: The Navigator App
At the end of each deployment shift, metadata saved in the app can be exported and compared with the project preplan to ensure accuracy of node placement and to QC other node status information. Software is provided by STRYDE to do this task very quickly even for the largest seismic surveys. We will discuss this in more detail later.
After nodes have been retrieved, the first task of the harvesting system is to retrieve the continuous data stream from each individual node. Once information about source timing and the live spread for each shot is loaded to the system, these continuous records are “combed” and windowed data traces extracted to form a “Receiver Gather” containing one trace per source event that was shot into that receiver. The headers in the Receiver Gather are annotated with shot and receiver information including coordinates, elevation, timing, and additional metadata related to the survey, and are ready for data processing.
Quality Control can be divided into two main categories:
- Survey and Positioning QC
- Seismic Data QC
Specific software has been developed by STRYDE to enable comprehensive QC of both types of data and metadata.
Survey data QC involves comparing actual deployment locations to planned locations and overall survey completeness. Some of the displays are map oriented and others would be table oriented so that large amounts of data can be visualized so that anomalies can be identified and then, of course, resolved.
For example, Figure 11 shows a map of receiver locations coloured by node status (deployed/harvested/to do)

Figure 11: Example survey map with stations labelled by status (blue: harvested, orange: deployed, black: to do)
Figure 12 shows a QC table highlighting several nodes with QC parameters that are out of spec with respect to quality thresholds that are defined at the survey level, which may require troubleshooting.
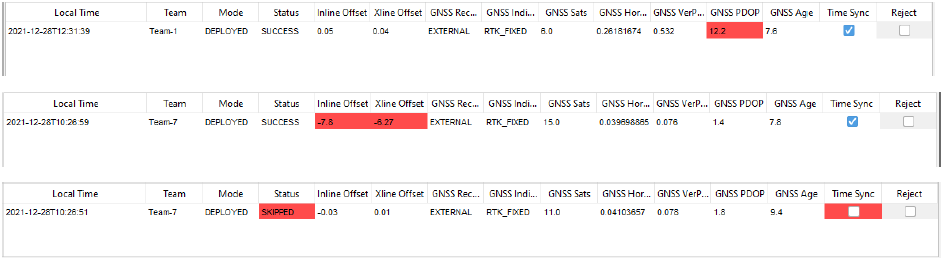
Figure 12: Receiver QC Table highlighting potential deployment issues for troubleshooting. Top: GNSS quality parameter “PDOP” is out of the allowed range, middle: station has been offset beyond the allowed inline and crossline threshold distances, bottom: station has been skipped
Similarly, source location maps (Figure 13) and tables (Figure 14) can be generated again to look for significant deviations from the project preplan or shots that were out of spec for various reasons. All common source controller formats are supported by the STRYDE QC software. The final validated list of source positions and times is then loaded to the STRYDE system servers so that final seismic deliverables can be constructed as soon as nodes have been harvested.
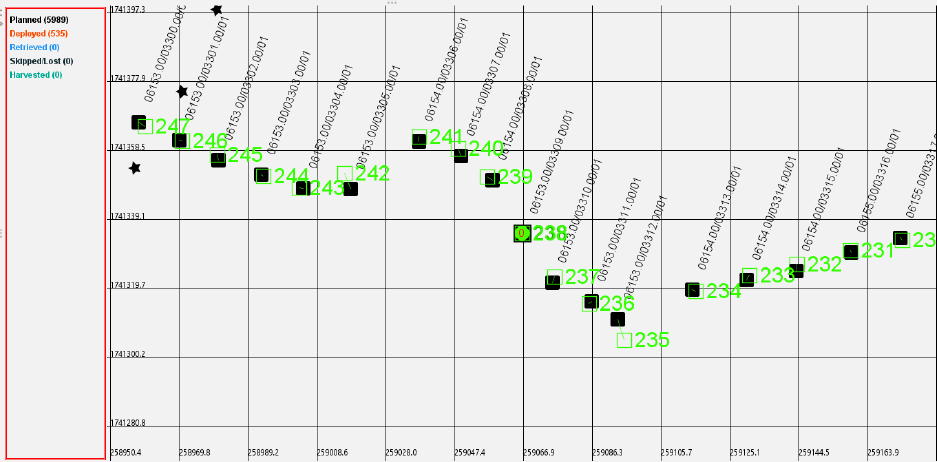 Figure 13: Source location QC map
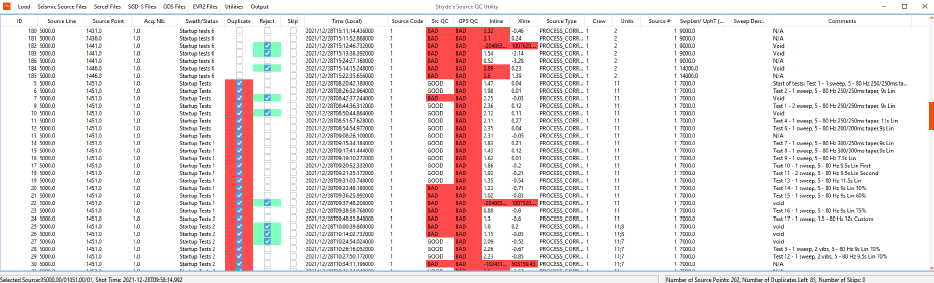 Figure 14: Source QC table
Tools for QC of seismic data
Now let’s turn our attention to the tools STRYDE provides for QC of the seismic data. When looking at the seismic trace data it is common to look in various domains from receiver gathers and shot gathers in Time and Frequency domains, including T-X, F-X, F-K.
T-X displays (Figure 15) can be used to look at the overall signal-to-noise ratio of the data as well as allowing for initial measurements of the first arrival/refractor velocities and some of the noise and signal velocities. Other attributes such as source and receiver elevations and coordinates can also be plotted from the headers to look for anomalies in the metadata.
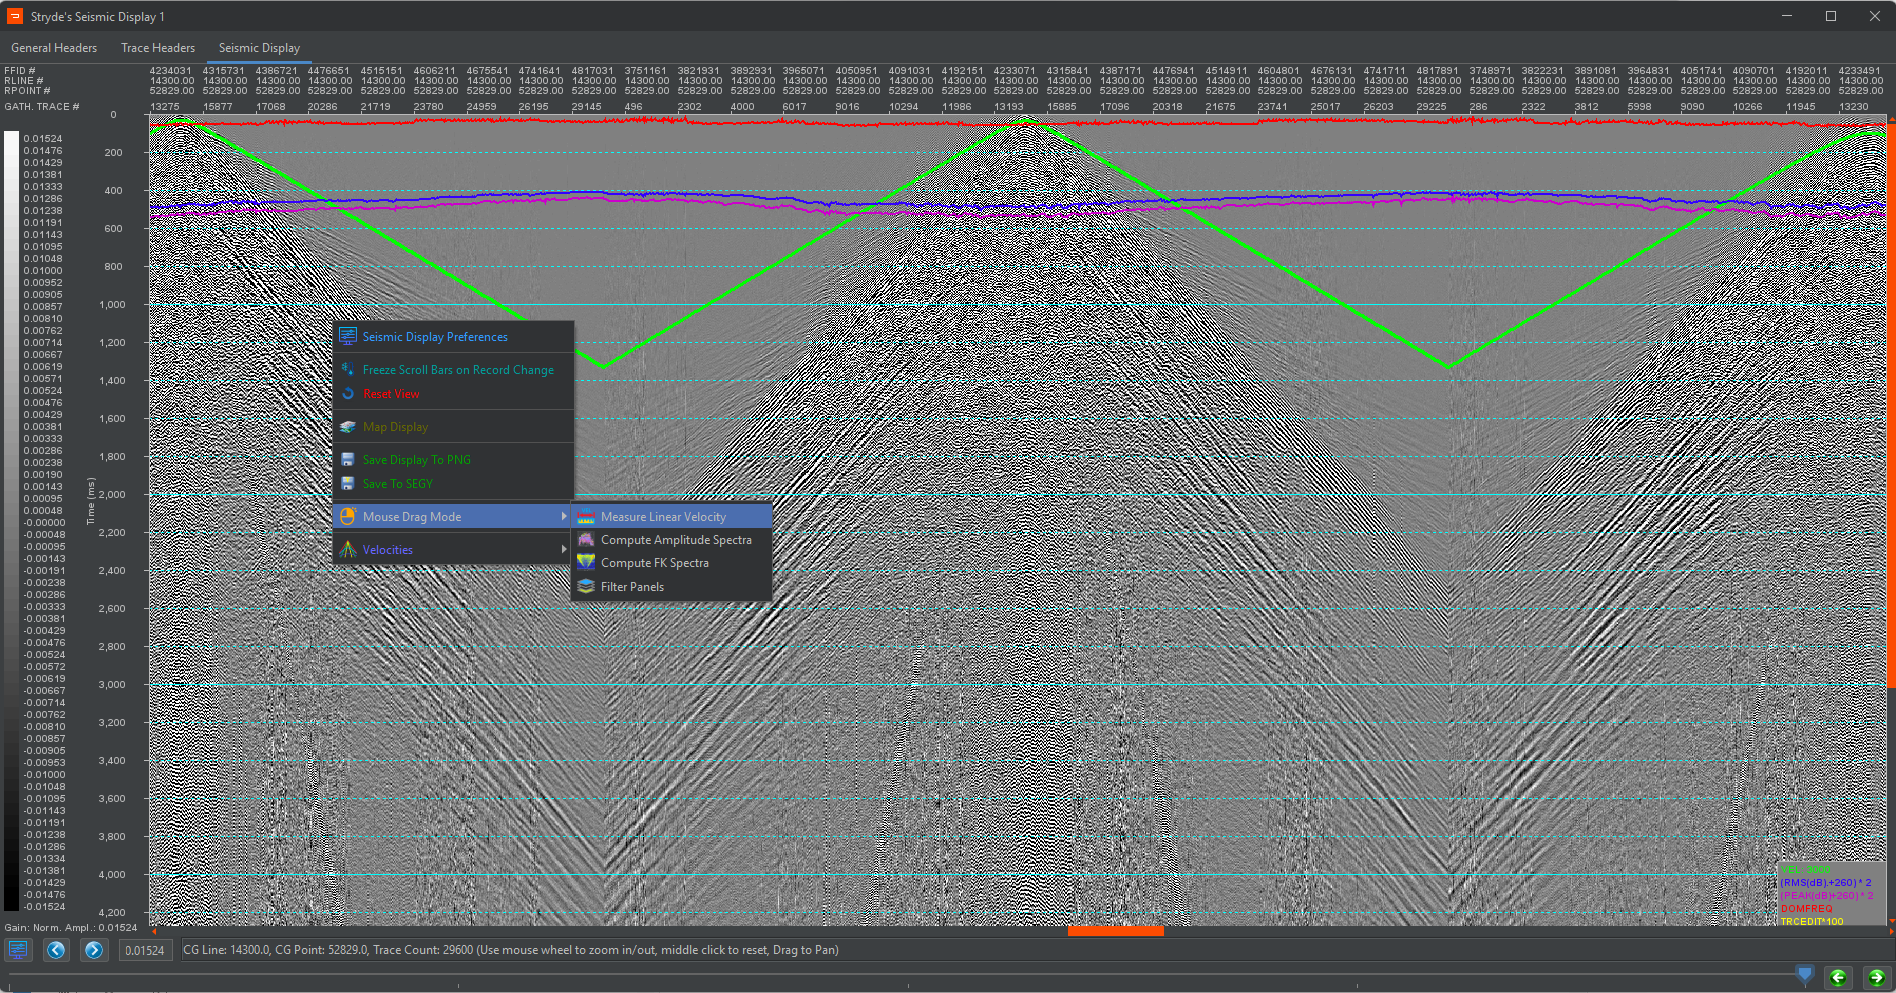
Figure 15: Example T-X display
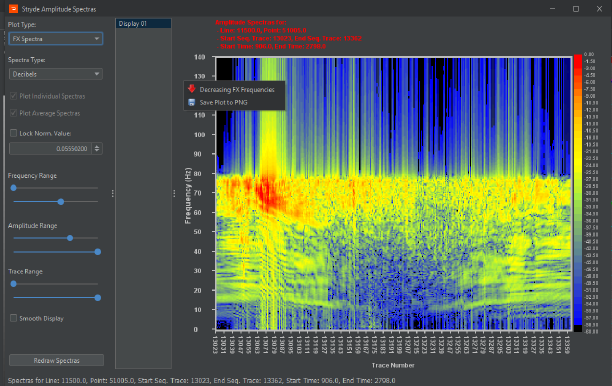
Frequency spectra (Figure 16) and F-X displays (Figure 17) can be used to check the overall frequency content of the trace data and determine how it varies with offset and proximity to known noise sources such as generators, power lines, roads, and other culture.
Key data quality attributes like RMS amplitude and dominant frequency can also be extracted from the data to create attribute maps that can be animated over time, which is extremely useful for assessing the overall character and level of noise across the spread, and for identifying time-varying noise sources.
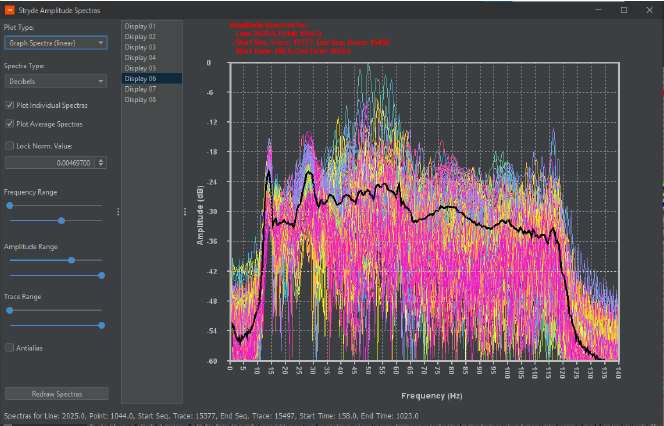 Figure 16: Frequency Spectral Analysis
F-K displays (Figure 18) are used to check for aliasing in the ground roll or other events. Aliasing is one of the main reasons to use nodal systems over cabled systems as nodal systems provide unlimited freedom to deploy many more receivers at closer inline and crossline spacing. This geometry helps enable processing to remove noise trains as the aliasing may be reduced or eliminated. The F-K display can tell you if you have achieved this goal or not.
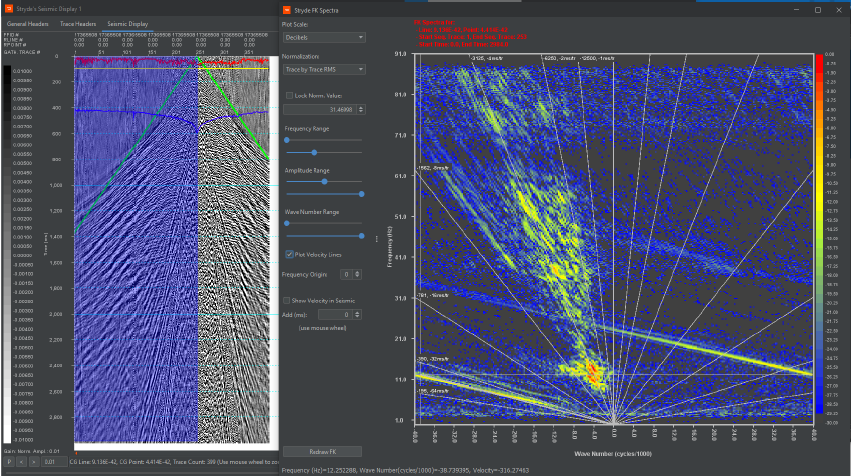
Figure 18, F-K Analysis Display
Overall, as the data is recorded and harvested, it is very important to QC the merging of the survey and the seismic and to make sure that the seismic data is of sufficient quality and quantity to meet the survey objectives. The STRYDE nodal system provides all the required capabilities to ensure that the data sent to processing and interpretation will achieve the objectives.